Introduction
The objective of this text is to describe the software designed by Sanches and Meireles (2013). For the construction of the software, a computational code developed using the Microsoft Visual Basic 6 language was used.
The software is available on this website. The operation manual is presented on this page.
The software can be installed in a Microsoft Windows environment (98, ME, XP, 7 or 8.x), and can only be used in a local environment (not available for corporate environments and web version).
Case: Distribution Center
Company Description:
For a detailed understanding of the software and its operation, an application case for this tool is described here. The “Distribution Center” case occurred in a company here called the Distribution Center that was established in the region of Jundiaí and today has more than 40 stores located in important cities in the interior of São Paulo, such as Jundiaí, Campinas and others.
n addition to its physical stores, it has a virtual one among the most accessed in Brazil, with delivery in any region of Brazil. Within the state of São Paulo, the company has an express delivery system that takes place in two days.
The problem
In the logistics area of the Distribution Center, the following problem is observed: low dispatch capacity of the Distribution Center.
The company since 2010 has invested in the growth of its e-Commerce business. To double its capacity from 2012 to 2013, it invested in automation technologies and equipment.
The company plans to increase by 50% the demand for 2014, totaling 12,000 orders a day. To direct the actions, a project to expand the shipping capacity was created. The challenge of this project was to understand how to achieve these goals, since the investments made in 2012 led to the capacity to deliver 8,000 orders a day in 2013.
For 2014, with an expected growth of 12,000 orders per day, further increases in operation would be necessary.
The determination of the root cause through the DC
 Once the problem was recognized, it was addressed using the DC software.
The six-person team responsible for solving the problem generated a list through brainstoming of 11 potential causes that could logically be recognized as contributing to the main effect: Low dispatch capacity of the Distribution Center:
- Low automation (treadmills, trolleys, etc.)
- Inappropriate WMS (Storage Management) software
- Absence of standardization of processes
- Poor process quality
- Absence of synergy between areas
- Low belt speed
- Low operation control
- not integrated areas and processes
- Flow between operations unbalanced
- low amount of operators
- Management based on individual capacity
 t was decided to use the DC software, given its ease of operation. The opening window of the software can be seen in the figure below:
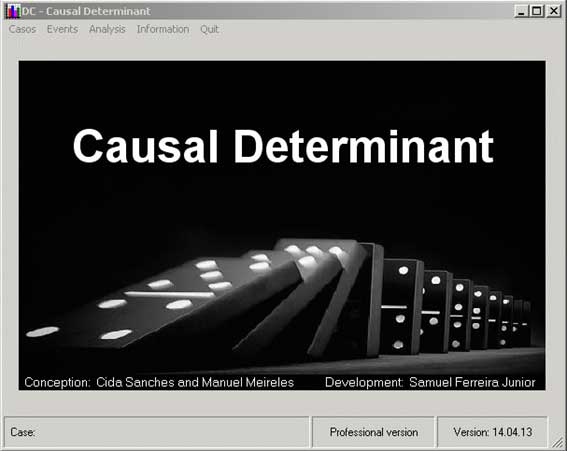
In the opening window you can see that there are five tabs: the Cases, Events and Analysis tabs are relevant to any registered case.
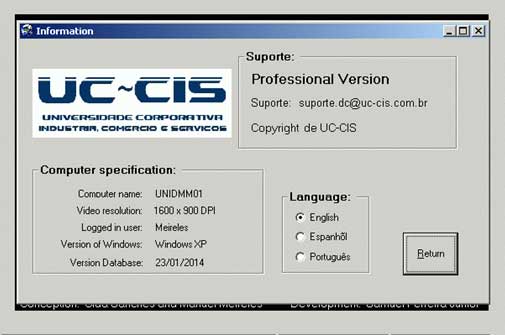
The Information tab contains the version of the Professional or Demo software (Demo), email for support, characteristics of the computer the software is running on: computer name, video resolution, logged in user, Windows version and bank version of data that the software is using. It is also possible to configure the language between three options: English, Spanish or Portuguese.
 Criar um novo Caso, cadastrando o Nome do caso, o objetivo a alcançar ou sintoma indesejado, assim como a quantidade de fatores a serem analisados.
The software in both versions (Professional and Demo) is provided with an example case “Clinical Examination Laboratory”. This example occupies the first position, so the new case was created in line 2.
In the “Case” line the user assigns the name to the study so that it can be referenced later. The name can be up to 80 characters long. In the line "Objective to achieve or Unwanted symptom" the user expresses the problem he faces or the objective he wants to achieve. The problem or challenge can be expressed in up to 80 characters.
In "Number of factors" the user marks how many factors the case being registered has. The Professional version supports up to 25 factors; the Demo version supports only 7 factors.
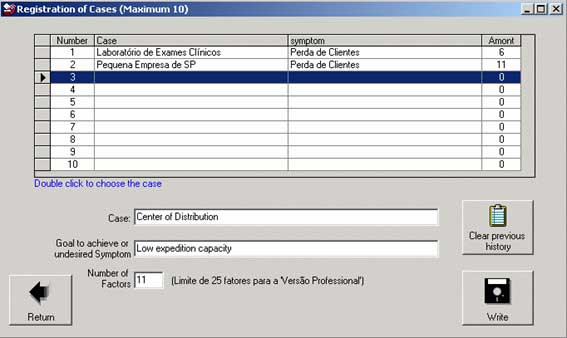
Case Registration Screen
 Create a new Case and register the Events to be analyzed using the Event Registration screen as shown in the figure below:
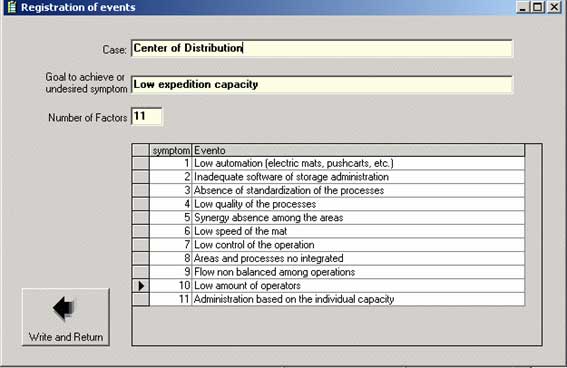
Event Registration Screen
 Together with the team, score each combination (row x column) and score based on the degree of relevance.
The comparison is made considering the factors in line with those in the column and the user only needs to place the mouse in one of the squares on the right or above the diagonal. When this operation is done, a window appears that requires the comparison to be made and assigns a certain number of points in the cell for the comparison.
It is recommended that the comparison be made by two or three people who know the problem well . The result of the comparison of being by consensus, that is, the people involved in the study agree that the choice made (much less / less / equally / more / much more) is the most appropriate.
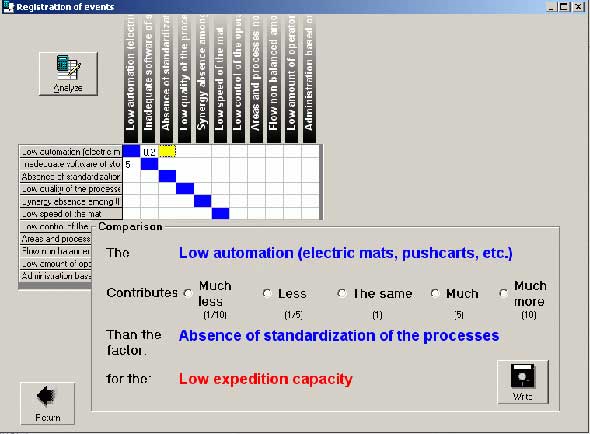
Comparison screen
When you click on a cell above or to the right of the diagonal, a window opens that allows the comparison between the two factors that intersect in the cell. In the figure below, a comparison is made between factor A (in the row) and factor B (in the column).
When choosing a result, a value (10; 5; 1; 1/5; or 1 / 10) is inserted into the cell. These weights are typical of the Prioritization Matrix, as shown below:
- a lot more (10);
- more (5);
- equally (1);
- any less (0.2);
- much less (0.1)
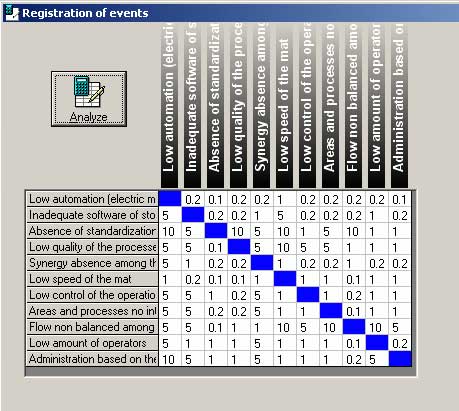
Screen for entering values for analysis
 Using the “Analyze” button in the figure above, the normalized values H and V refer to the totals of the rows and columns are obtained. For this step, the procedure of a typical Prioritization Matrix was applied.
 The result of the analysis is shown in the figure below:
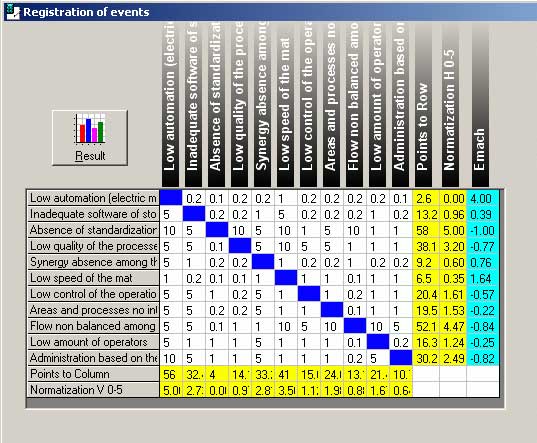
Result obtained after analysis
The sums of ‘row points’ and ‘column points’ were calculated. Note that the sum of the column points is a simple procedure, although not included in the Prioritization Matrix.
These values were then normalized, obtaining:
- The normalization H (or horizontal) corresponding to the normalization of the totals of the lines in the interval 0-5;
- The normalization V (or vertical) corresponding to the normalization of the column totals in the range 0-5.
Both normalization V and normalization H are performed in the interval [0; 5] using the following formula: where p is the number of points, min is the lowest observed value and max the highest observed value. Standardization follows the recommendations of Dodge (2003).
For example for the last value 30.2 we have:

Thus, we have two groups of values: the normalized values H corresponding to the sums of the values arranged in the lines and the normalized values V corresponding to the sums of the values arranged in the columns.
The H value can be considered as a causal outcome, that is, how much load the factor has to respond (be responsible) for the event under analysis (in this case 'low shipping capacity'). Examining the figure below, it is clear that ‘Absence of Standardization’, ‘Unbalanced Flow Between Operations’, and ‘Management Based on Individual Capability’ stand out as predominantly causal factors. H is an active value, therefore.
 Calculate the Emach of each factor. With the outputs H and V of the Prioritization Matrix, the table with the Emach value for each factor is prepared.
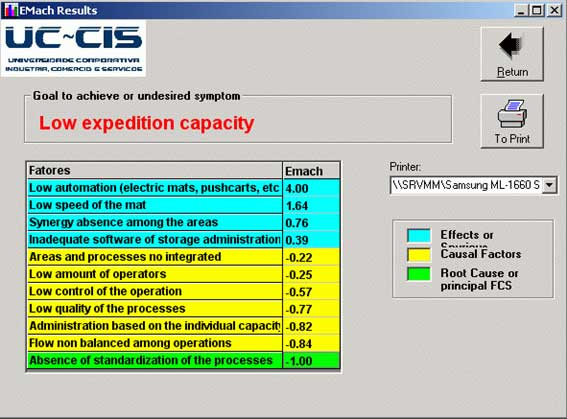
Emach calculations for each factor
Emach is a variable that expresses the sense and potency of the factor in the cause-effect relationship (C-E). Causal factors are negative and effect factors are positive as shown in the figure above. The higher the Emach of the factor the more effect it expresses. Emach's limits are -1 (root cause) and 4, the main symptom of the effect; the root cause is the factor with Emach -1: in this example it is 'Absence of Standardization in Processes'.
Still in the figure above, it can be seen that it is possible to choose a printer that is installed and make an impression to document the final result.
The company that applied the DC software intensified the analysis, training and standardization of all shipping processes, identifying in this study a significant gap between the productivity of the operators who performed the same function.
By developing the work pattern and training operators, the sector achieved an increase of 40% in productivity. Another 10% were obtained with actions based on the other main causal factors pointed out by the CD.
